By Jon R. Theriault, CFP®, CKA®, MBA
We are now into our fifth decade of managing investments at RS Crum, which means we’ve seen our share of market cycles along the way. That said, we will soon reach the ten-year anniversary of when, in early October 2007, the S&P 500 Index hit what was its highest point before losing more than half its value over the next year and a half. Although the duration of positive returns for investors since 2009 has been unusual, the inevitable rebound following such a major market event was not.
We wanted to spend some time revisiting the financial crisis, illustrating how markets have historically rebounded from major downturns, and provide some thoughts on how to best prepare for navigating periods of extreme volatility in the future.
LOOKING BACK
In the months ahead, there will likely be a number of retrospectives on what happened, as well as opinions on how the environment today may be similar or different from the period leading up to the crisis. It is difficult to draw useful conclusions based on such observations as financial markets have a habit of behaving unpredictably in the short run. There are, however, important lessons investors might be well-served to remember given markets have historically rewarded investors over the long term.
Being so many years removed from the crisis may make it easier to take the past in stride. The eventual rebound and subsequent years of double-digit gains have helped in this regard. But while the events of the crisis were unfolding, a future of this sort looked anything but certain. Headlines suggesting doom for world markets dominated the news, and opening quarterly statements or going online to check account balances were, for many, stomach-churning experiences.
While being an investor today (or during any period, for that matter), is by no means a worry-free experience, the feelings of panic and dread felt by many during the crisis were painful and long lasting. Many investors reacted emotionally to these developments. In the heat of the moment, some decided it was more than they could handle, so they sold out of stocks. Those who were able to stay the course, and adhere to a disciplined strategy, benefited greatly from the subsequent rebound.
HISTORICAL MARKET RECOVERIES
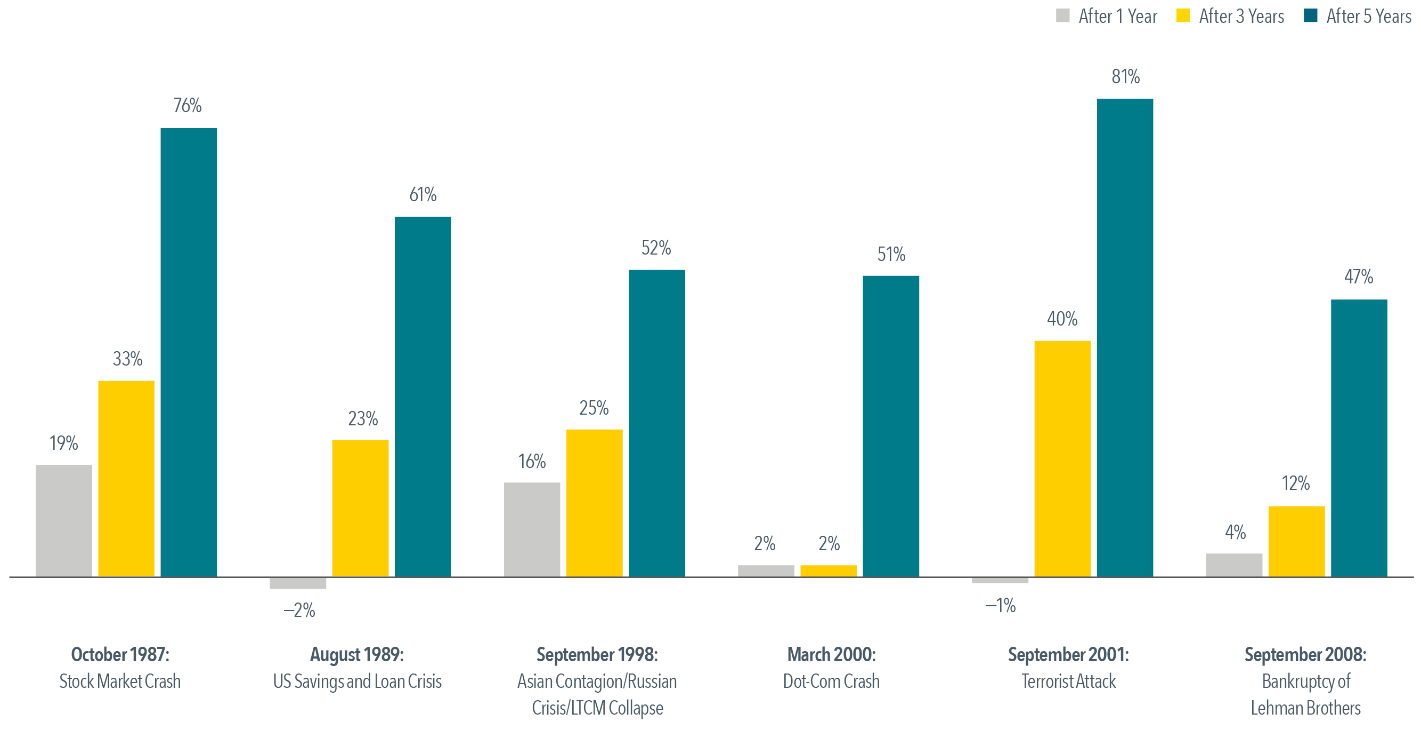
There are many times in recent history where a major market downturn has been followed by a robust market recovery. As an illustration, the exhibit below shows the performance of a balanced investment strategy* following several crises, including the bankruptcy of Lehman Brothers in September of 2008, which took place in the middle of the financial crisis. Each event is labeled with the month and year that it occurred or peaked.
Although a balanced, globally diversified investment strategy would have suffered losses immediately following most of these events, financial markets did recover impressively, as can be seen by the three- and five-year cumulative returns.
Exhibit 1 – Performance of a Balanced Strategy: 60% Stocks/40% Bonds (Cumulative Total Return)
PREPARING FOR THE FUTURE
One thing investors can count on is the fact that markets will not continue to rise year-in, year-out as they have since the crisis. There will undoubtedly be corrections, both large and small, and periods of extreme volatility and doomsday headlines, but a lack of preparation will cause many investors to make emotionally charged mistakes when the next crisis arrives. There are preventative steps to take, and having an experienced advisor to help counsel you along the way can prove critical when things look their darkest.
We prepare our client portfolios for such periods by maintaining a long-term perspective, appropriate diversification, and an asset allocation that aligns with one’s risk tolerance and goals. Making sure our clients have a balanced portfolio of stocks and bonds, understanding how their investments work in concert with other assets (such as real estate or business interests), and placing an emphasis on liquidity, all help position our clients for times when markets retract.
At the end of the day, helping clients navigate to the other side of major downturns is something we don’t want to happen often, but we will always be prepared to do so.
*In US dollars. Represents cumulative total returns of a balanced strategy invested on the first day of the following calendar month of the event noted. Balanced Strategy: 12% S&P 500 Index,12% Dimensional US Large Cap Value Index, 6% Dow Jones US Select REIT Index, 6% Dimensional International Marketwide Value Index, 6% Dimensional US Small Cap Index, 6% Dimensional US Small Cap Value Index, 3% Dimensional International Small Cap Index, 3% Dimensional International Small Cap Value Index, 2.4% Dimensional Emerging Markets Small Index, 1.8% Dimensional Emerging Markets Value Index, 1.8% Dimensional Emerging Markets Index, 10% Bloomberg Barclays Treasury Bond Index 1-5 Years, 10% Citigroup World Government Bond Index 1-5 Years (hedged), 10% Citigroup World Government Bond Index 1-3 Years (hedged), 10% BofA Merrill Lynch 1-Year US Treasury Note Index. The S&P data are provided by Standard & Poor’s Index Services Group. The Merrill Lynch Indices are used with permission; copyright 2017 Merrill Lynch, Pierce, Fenner & Smith Incorporated; all rights reserved. Citigroup Indices used with permission, © 2017 by Citigroup. Bloomberg Barclays data provided by Bloomberg. For illustrative purposes only. Dimensional indices use CRSP and Compustat data. Indices are not available for direct investment. Their performance does not reflect the expenses associated with the management of an actual portfolio. Past performance is not a guarantee of future results. Not to be construed as investment advice. Rebalanced monthly. Returns of model portfolios are based on back-tested model allocation mixes designed with the benefit of hindsight and do not represent actual investment performance.